Home » SYSPRO’s Privacy Policy
Home » SYSPRO’s Privacy Policy
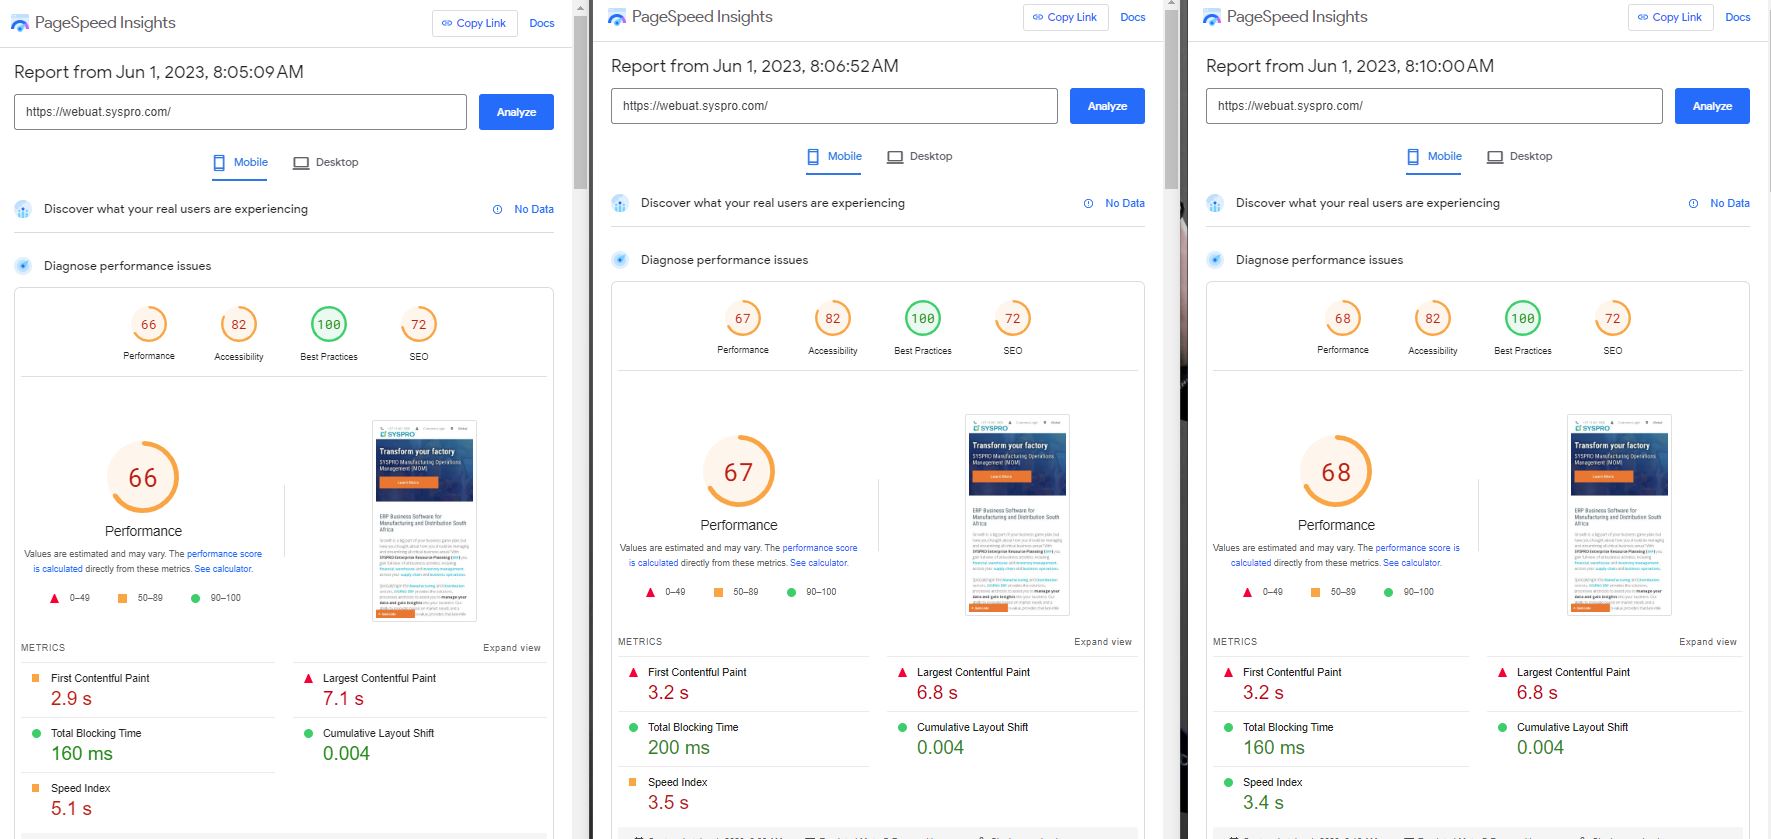
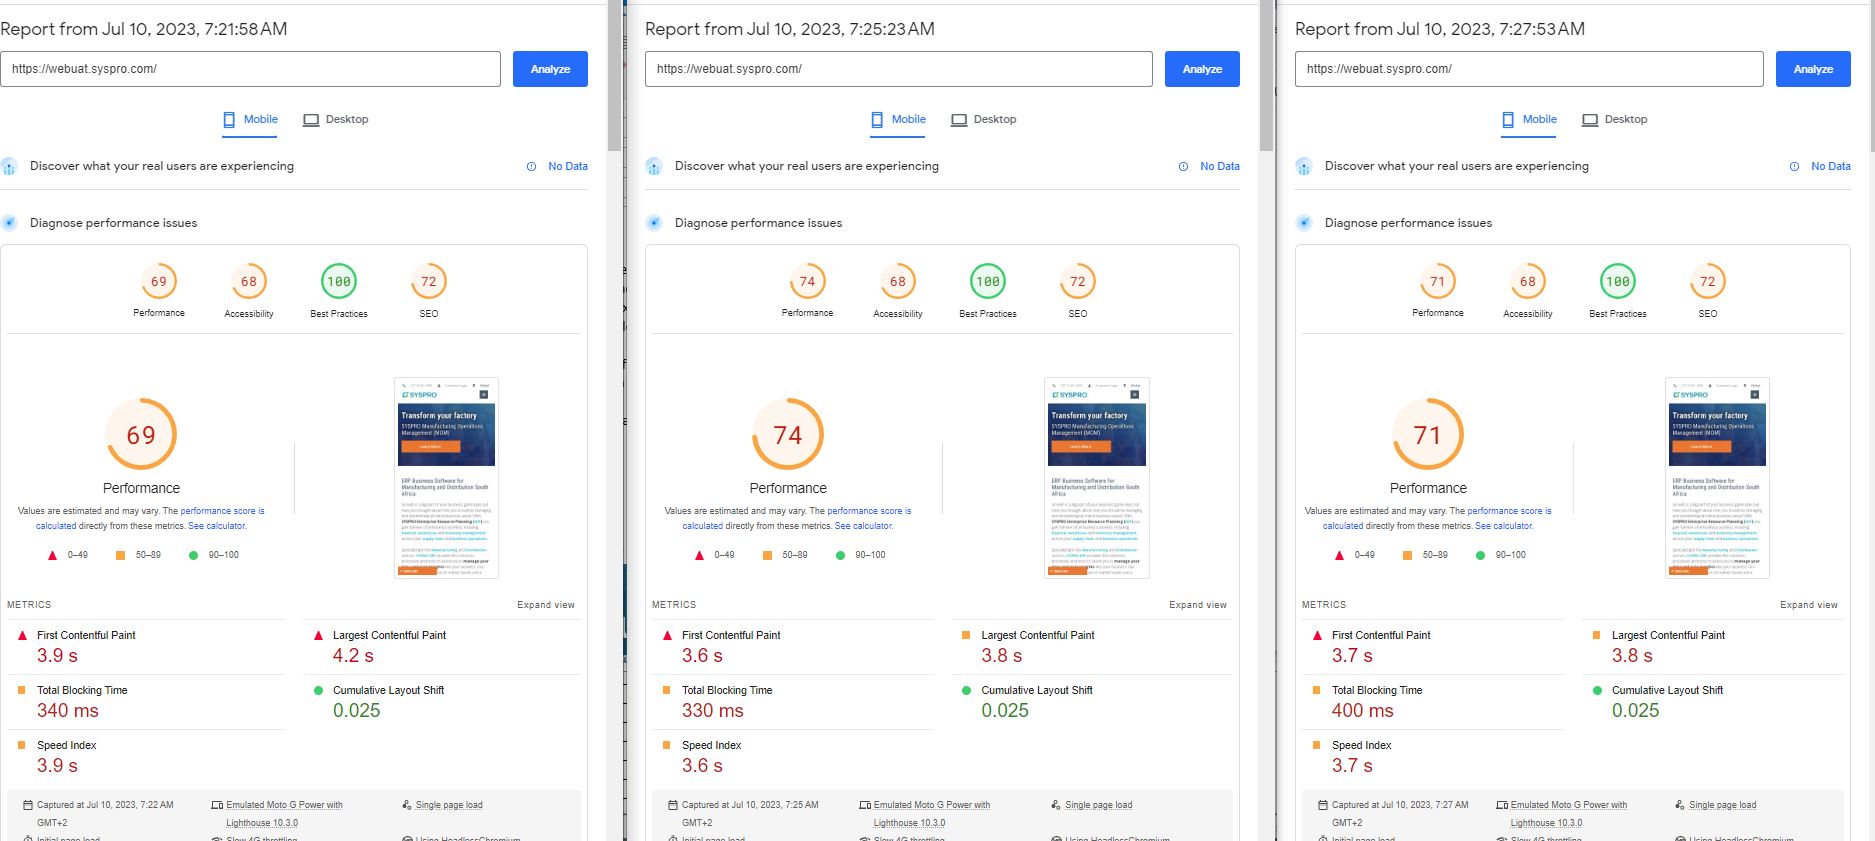
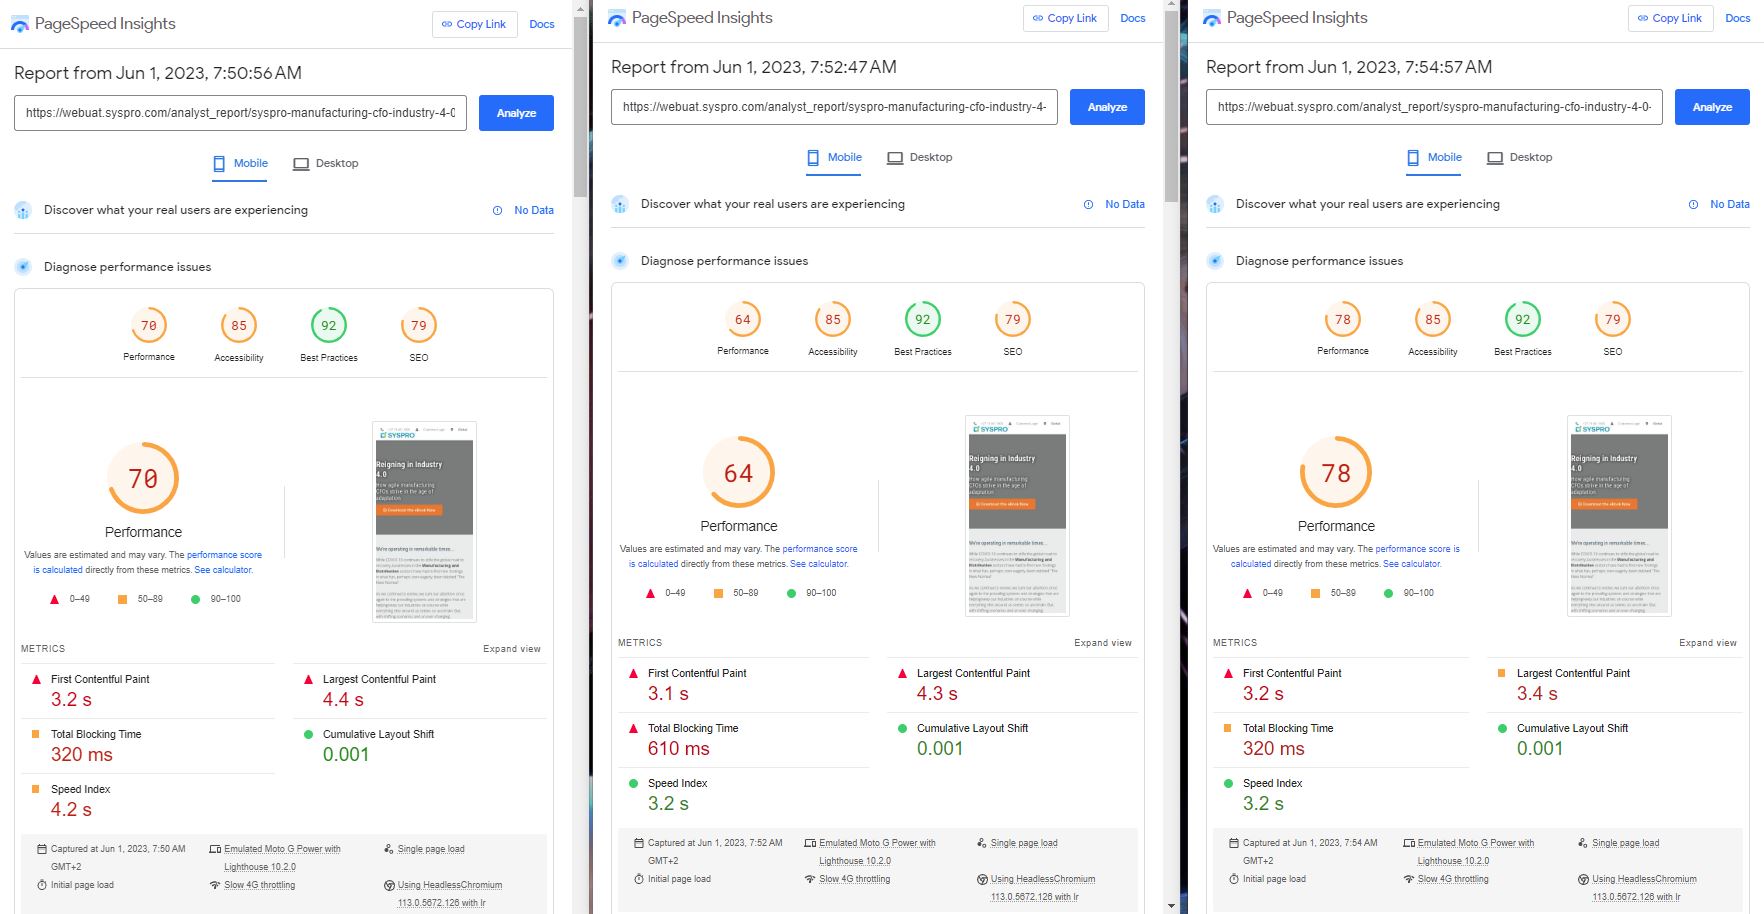
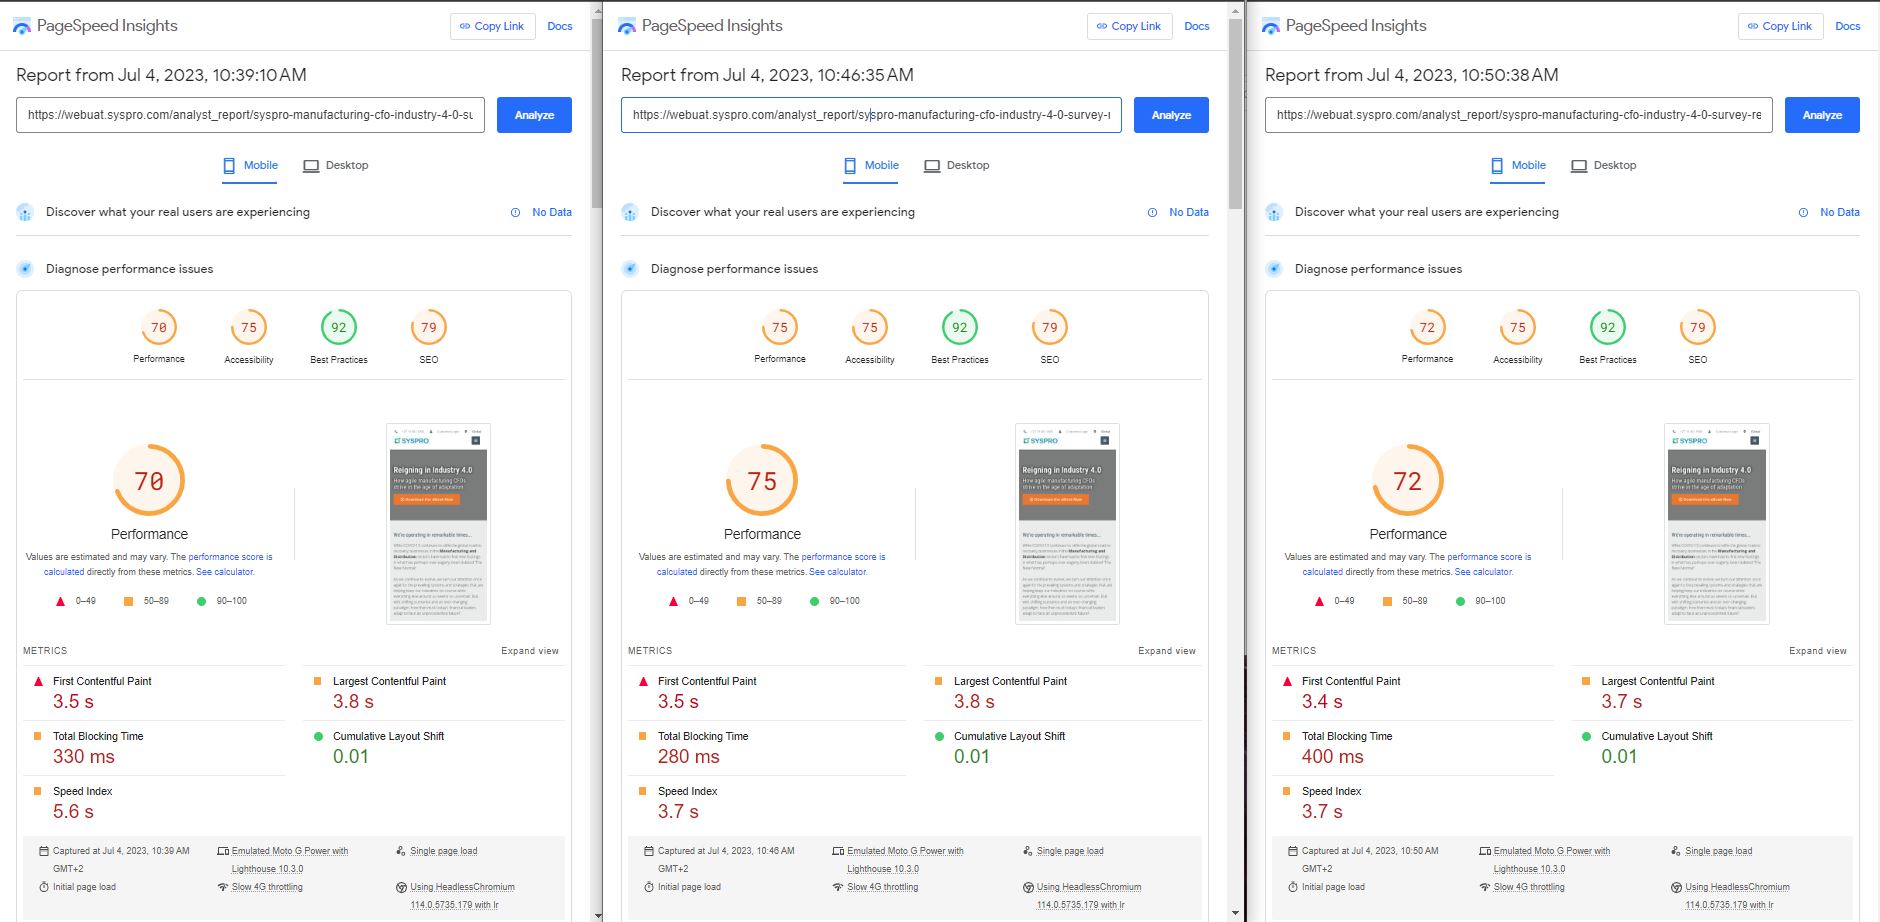
| Page | Score #1 | Score #2 | Score #3 | Average Score |
|---|---|---|---|---|
| Home Page Mobile Pre-Opt | 66 | 67 | 68 | 67 |
| Home Page Mobile Post-Opt | 69 | 74 | 71 | 71 (+4) |
| CFO Industry Report Page Mobile Pre-Opt | 70 | 64 | 78 | 71 |
| CFO Industry Report Page Mobile Post-Opt | 70 | 75 | 72 | 72 (+1) |
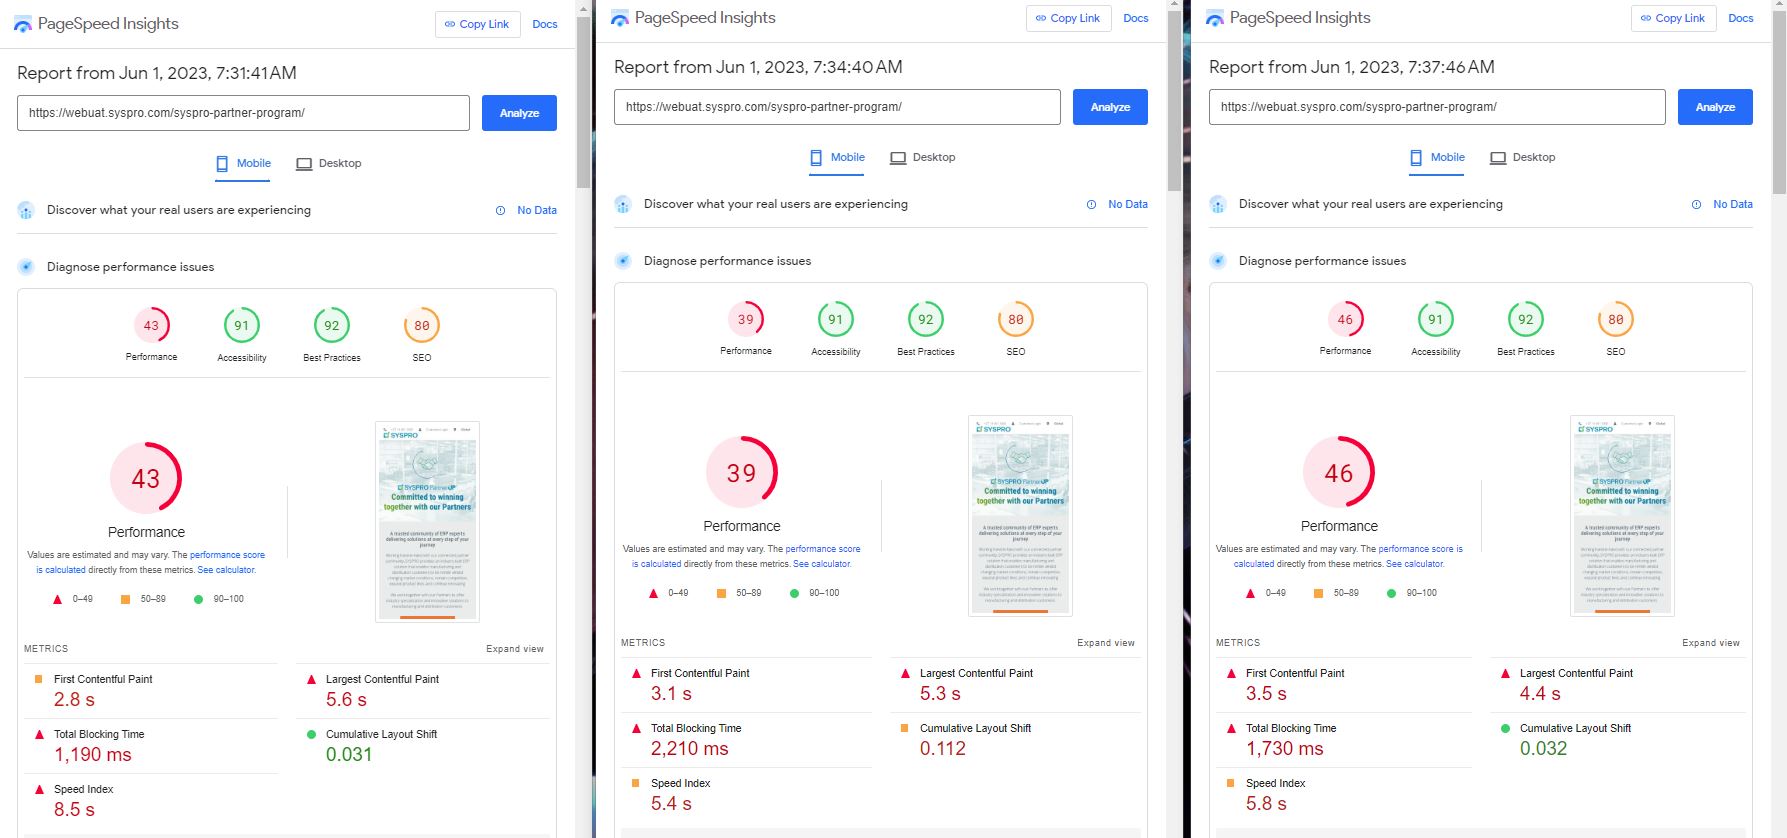
| Partner Program Page Mobile Pre-Opt | 43 | 39 | 46 | 43 |
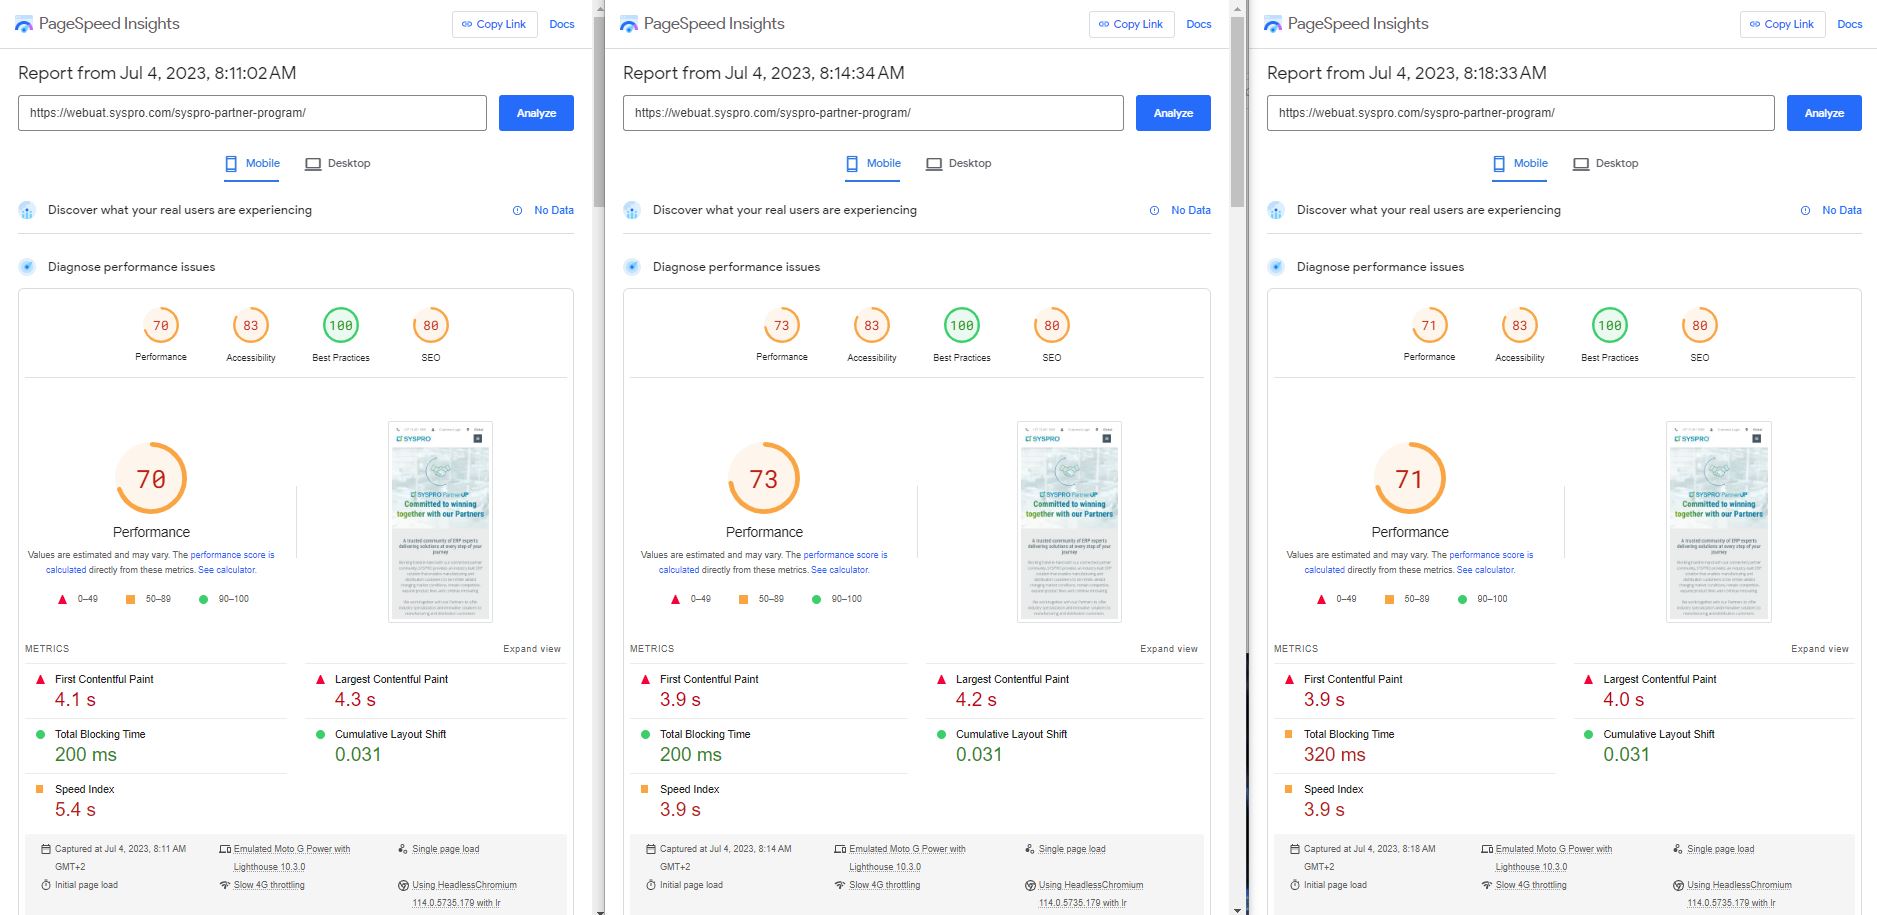
| Partner Program Page Mobile Post-Opt | 70 | 73 | 71 | 71 (+28) |
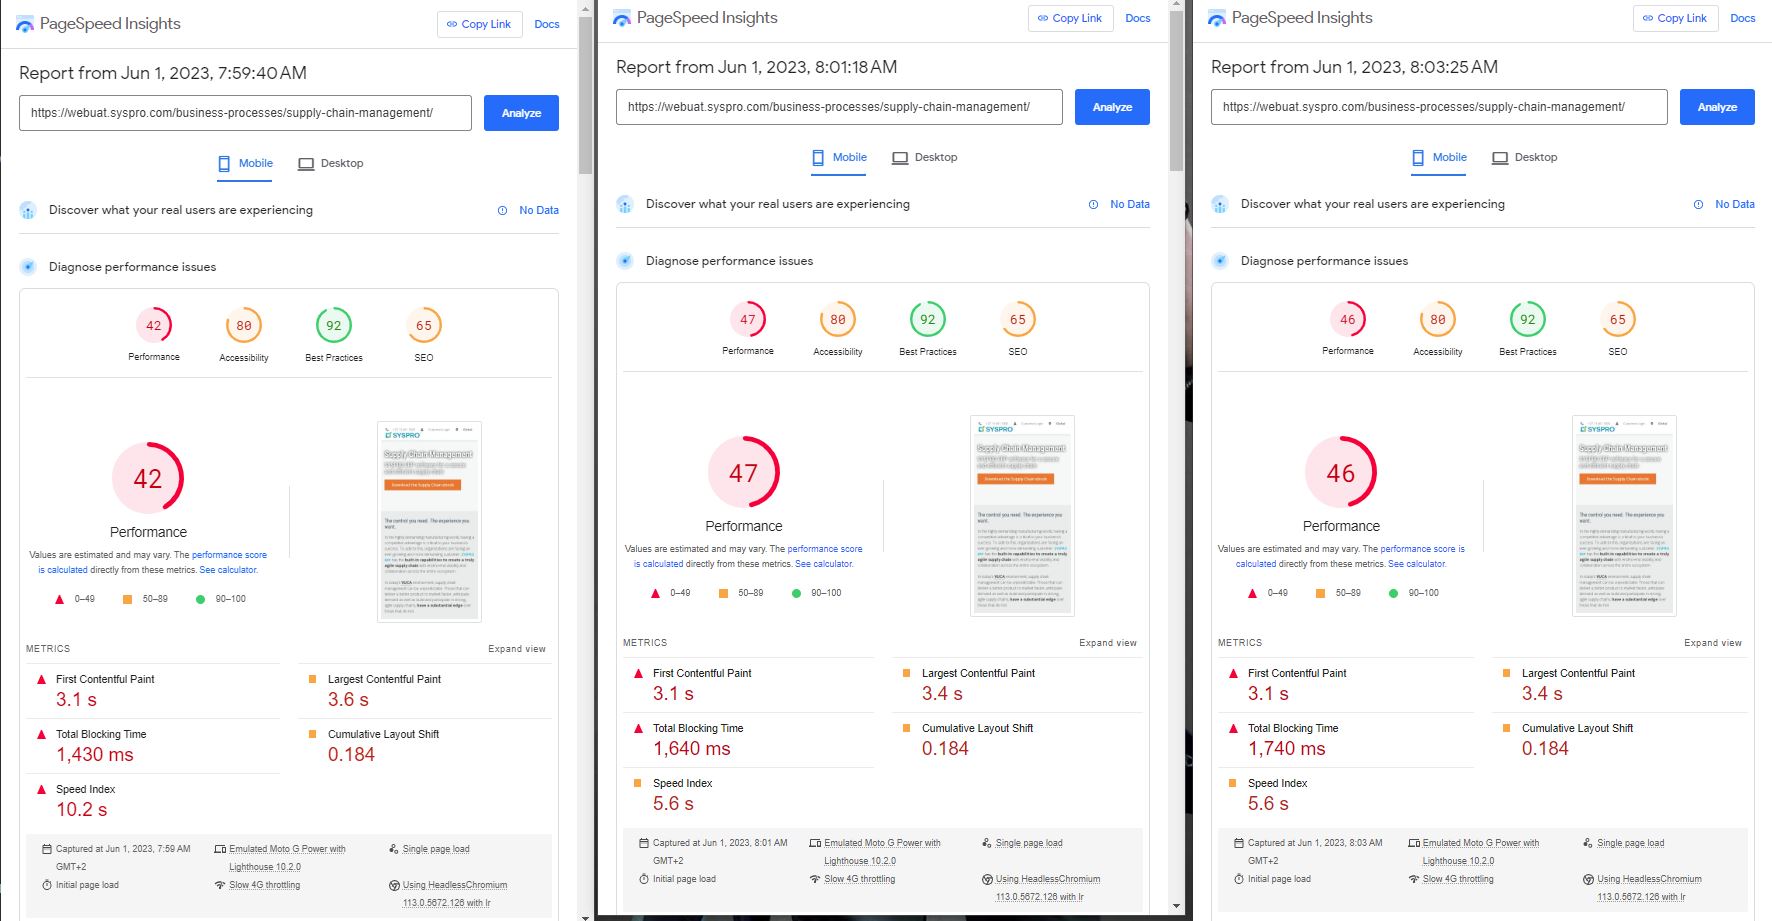
| Supply Chain Page Mobile Pre-Opt | 42 | 47 | 46 | 45 |
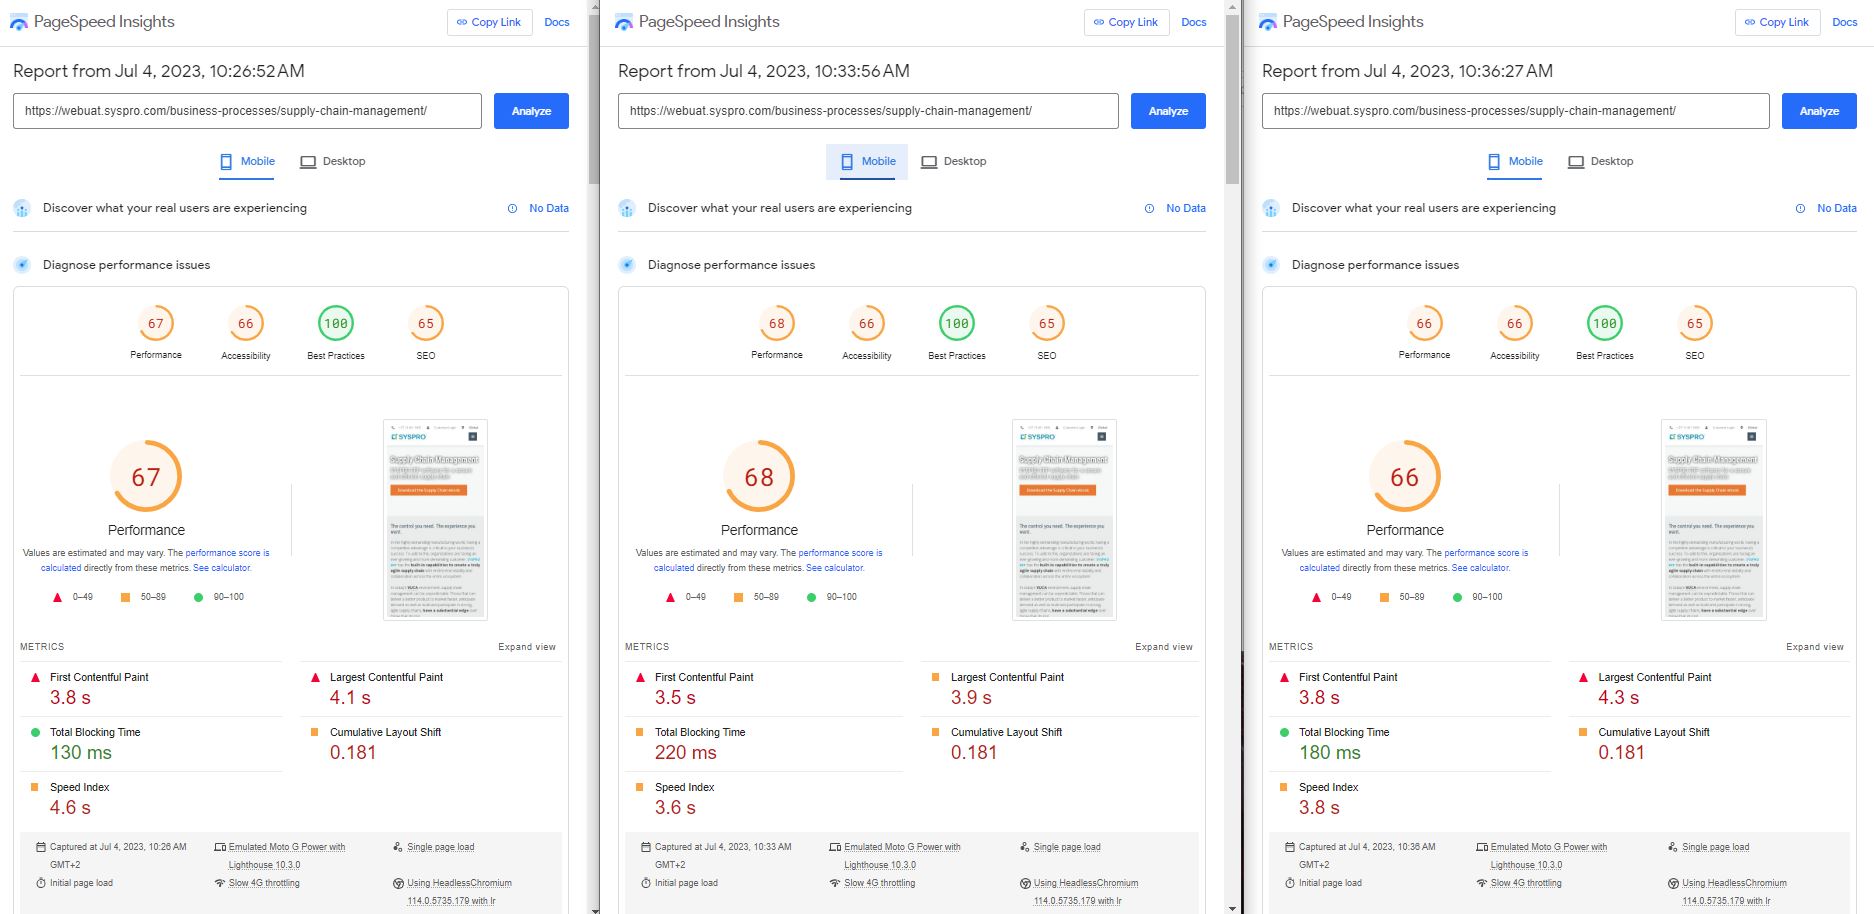
| Supply Chain Page Mobile Post-Opt | 67 | 68 | 66 | 67 (+22) |
Use the slider to view and compare the performance score screen captures
