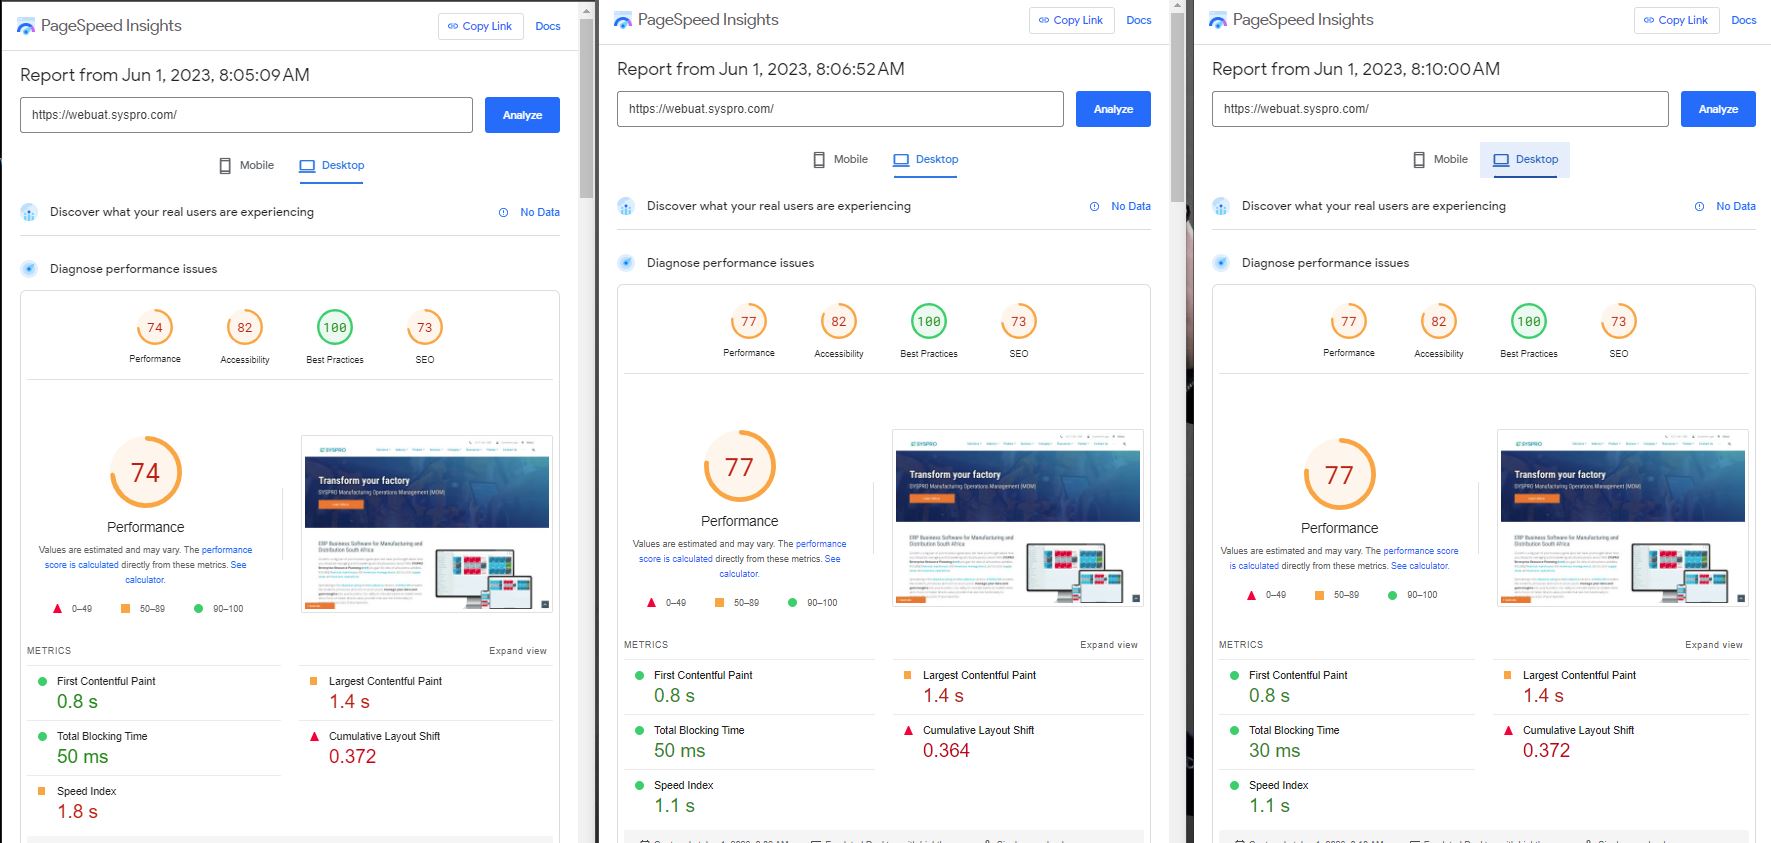
| Home Page Desktop Pre-Opt | 74 | 77 | 77 | 76 |
| Home Page Desktop Post-Opt | 79 | 79 | 94 | 84 (+8) |
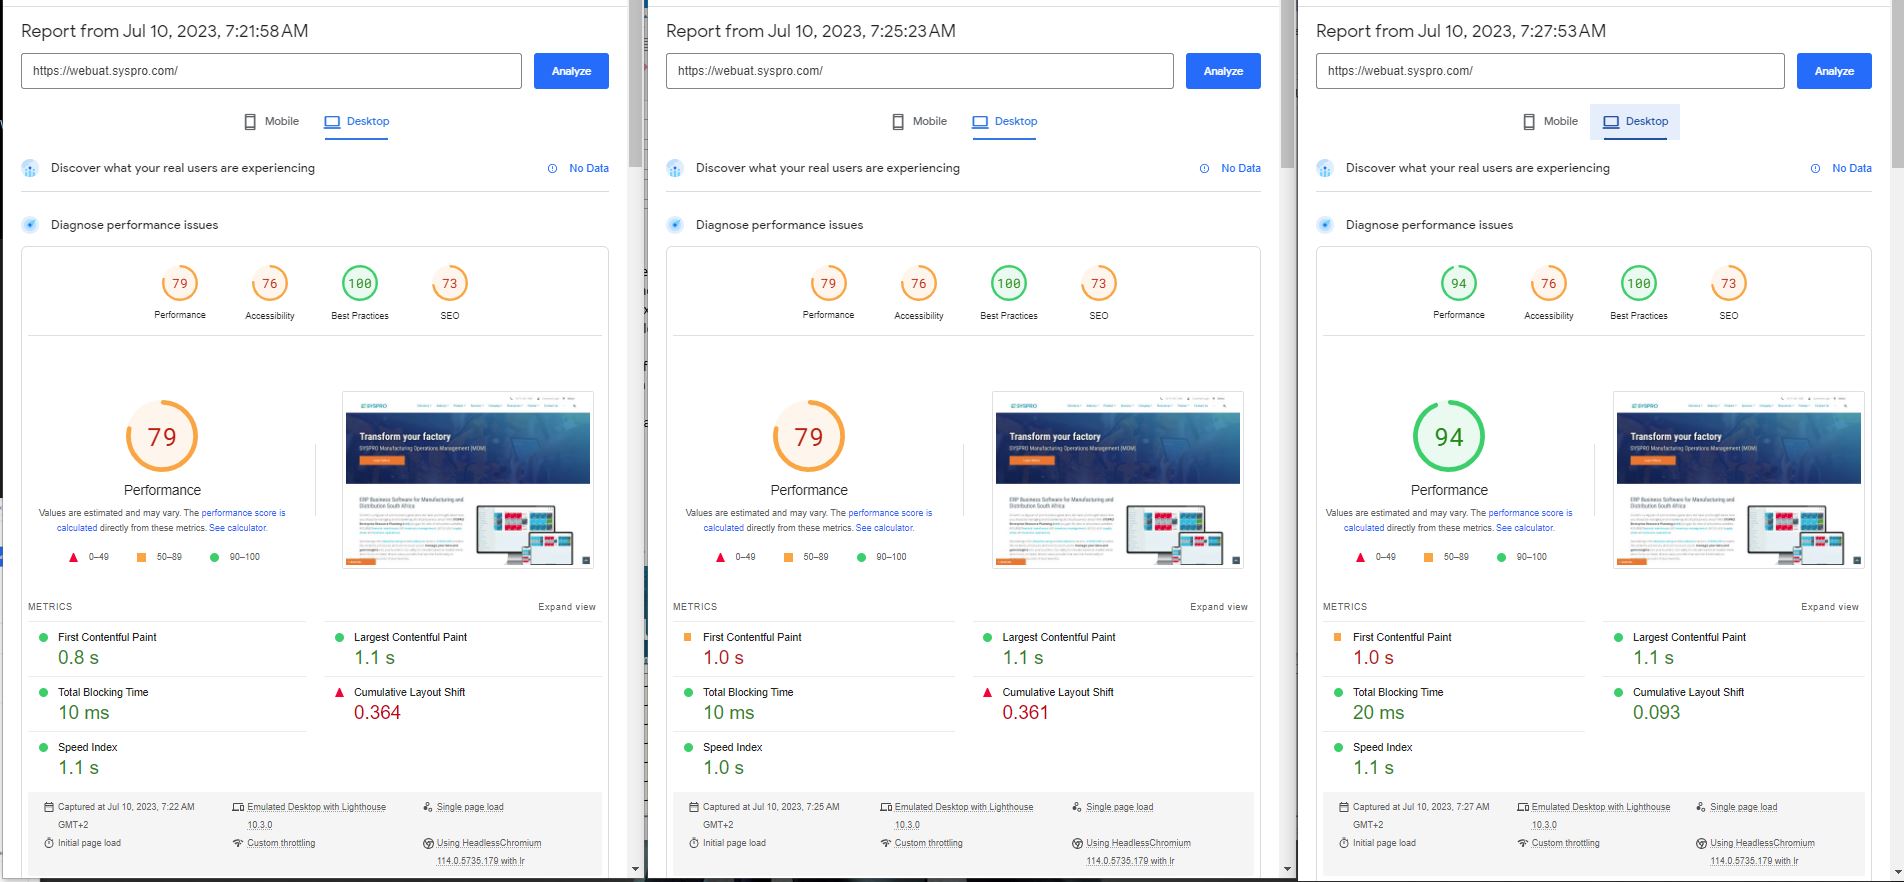
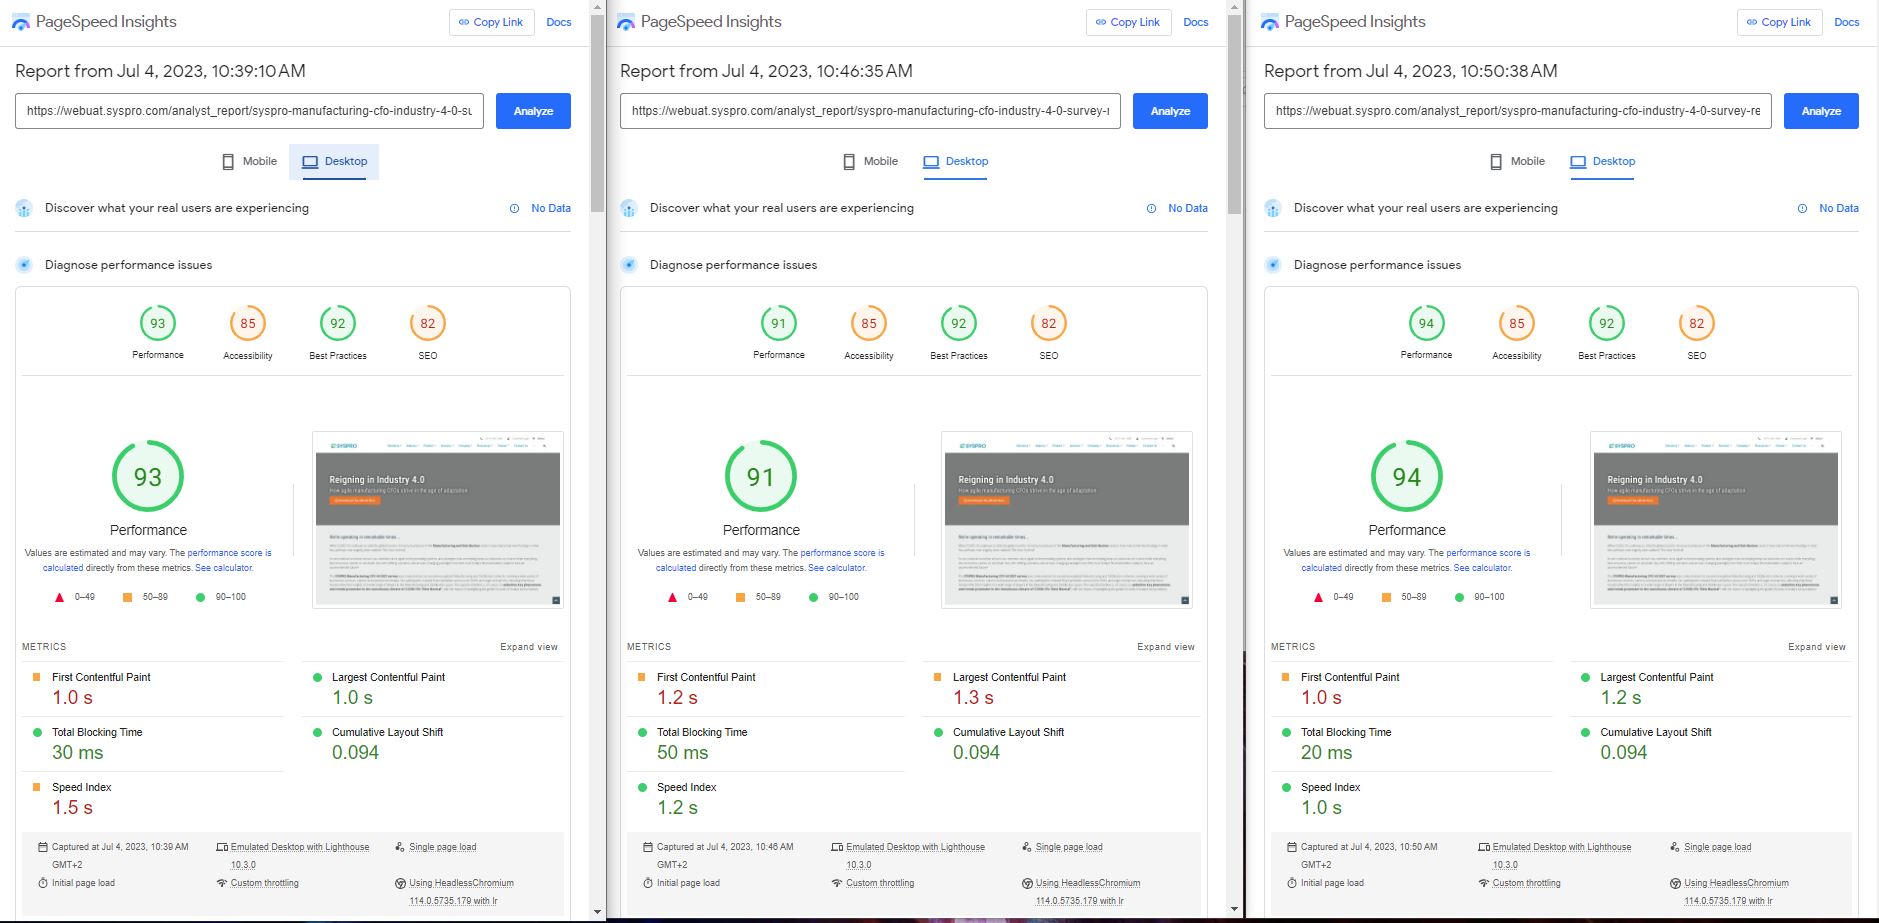
| CFO Industry Report Page Desktop Pre-Opt | 88 | 91 | 96 | 92 |
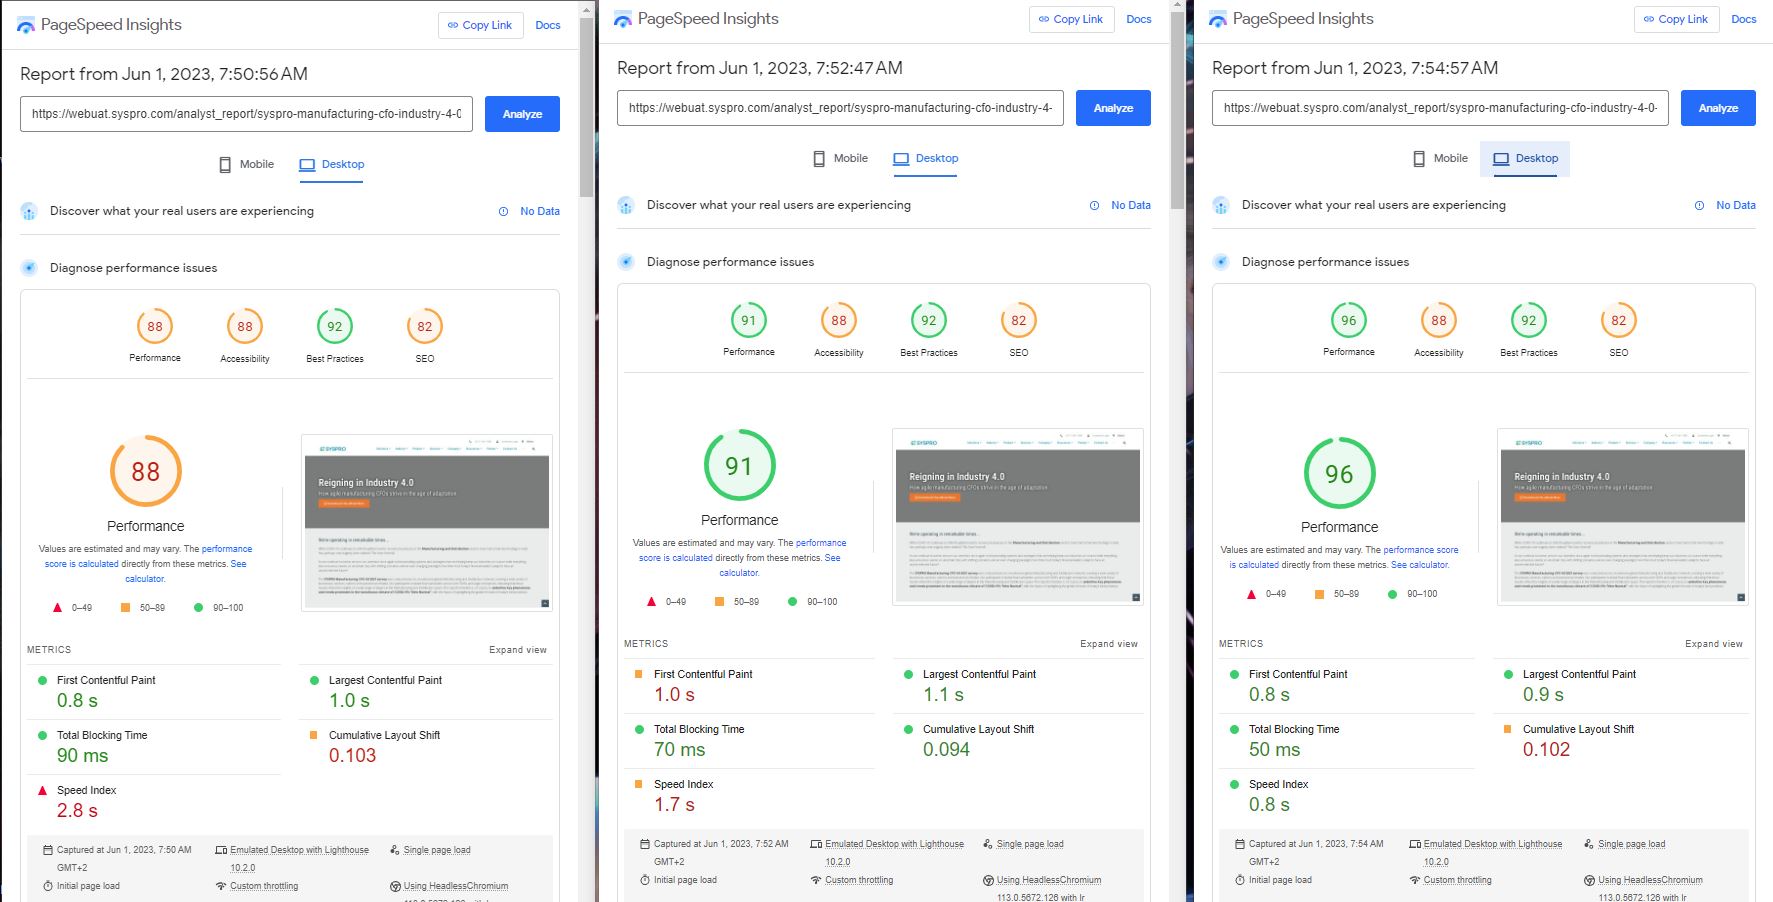
| CFO Industry Report Page Desktop Post-Opt | 93 | 91 | 94 | 93 (+1) |
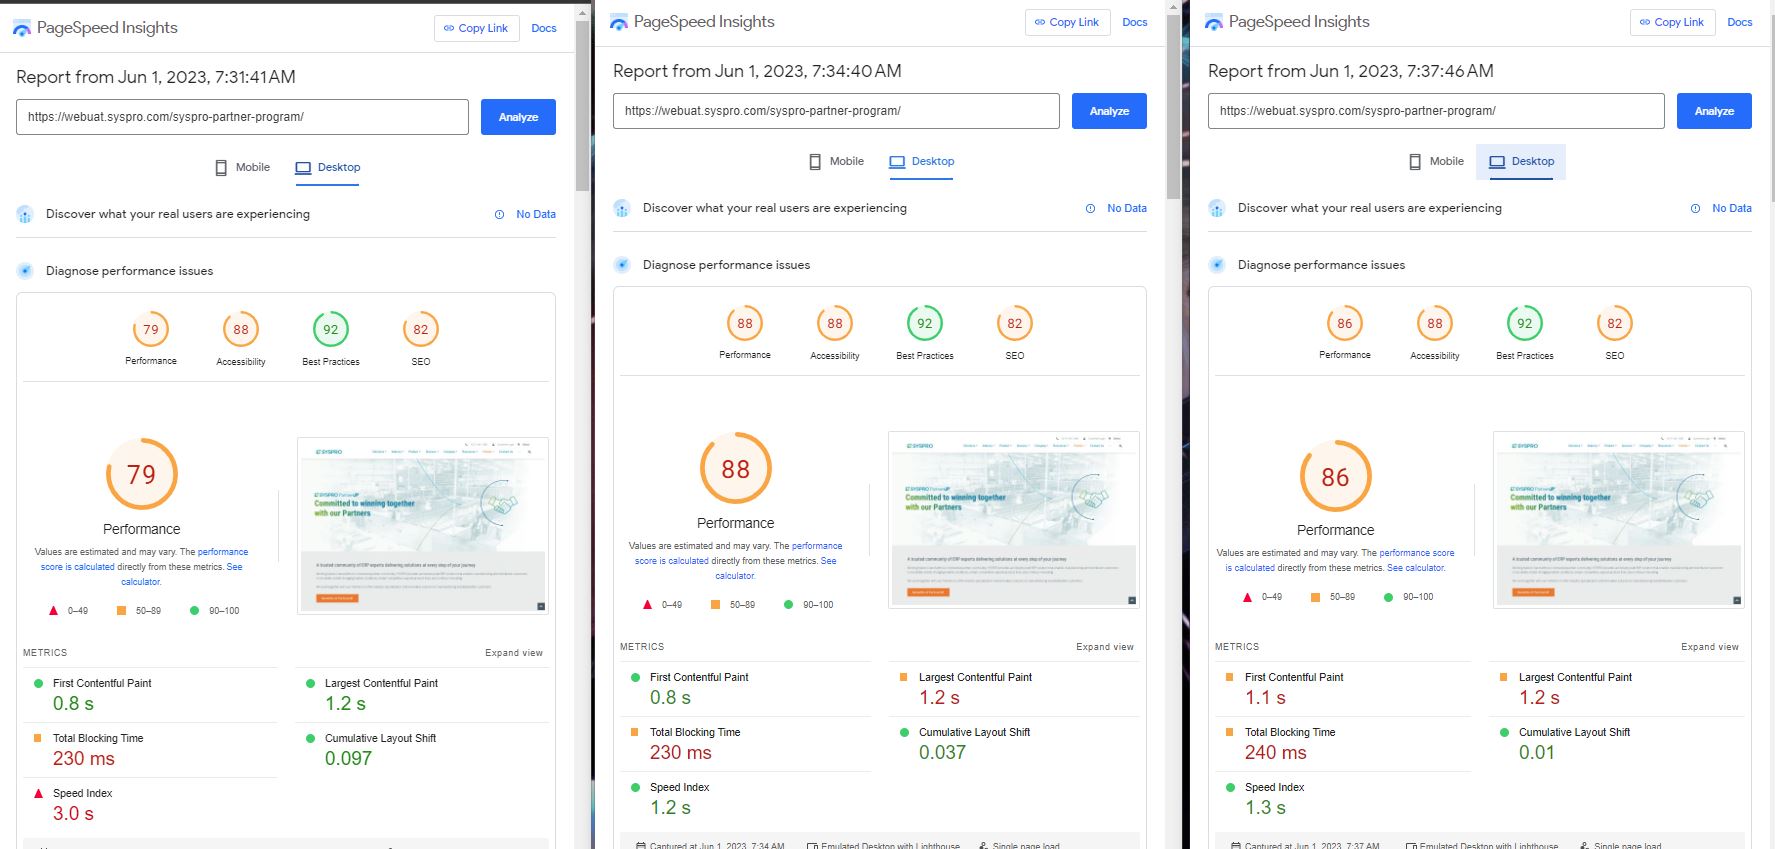
| Partner Program Page Desktop Pre-Opt | 79 | 88 | 86 | 84 |
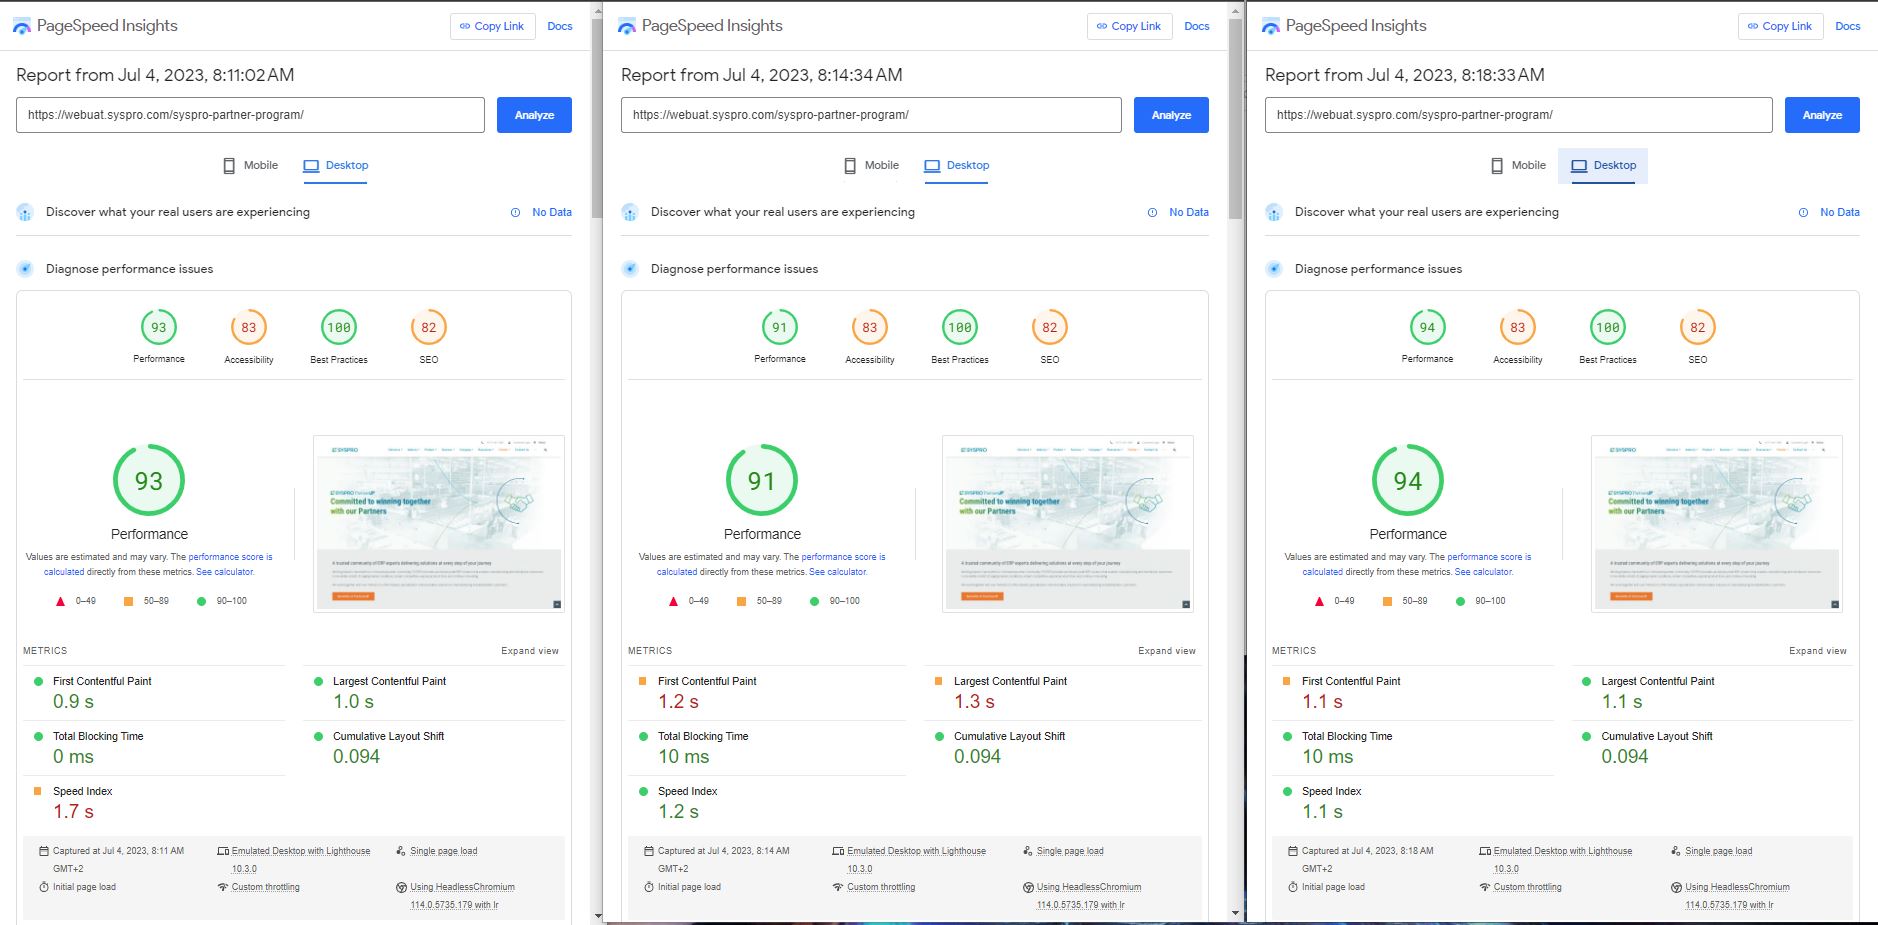
| Partner Program Page Desktop Post-Opt | 93 | 91 | 94 | 93 (+9) |
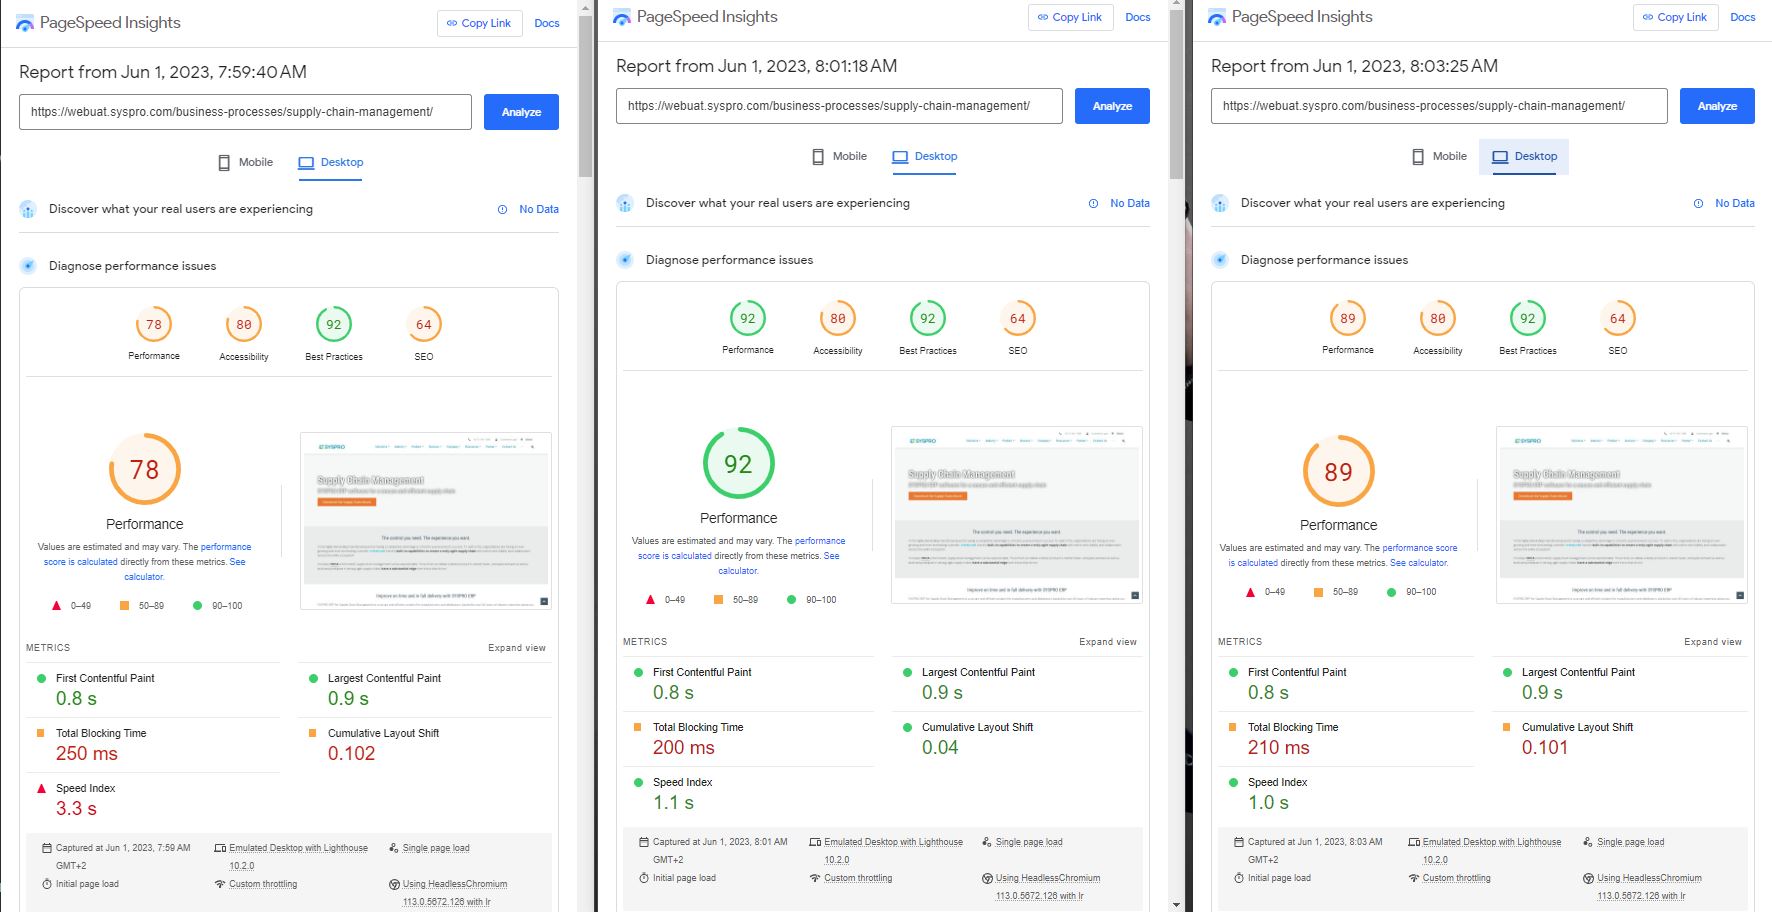
| Supply Chain Page Desktop Pre-Opt | 78 | 92 | 89 | 86 |
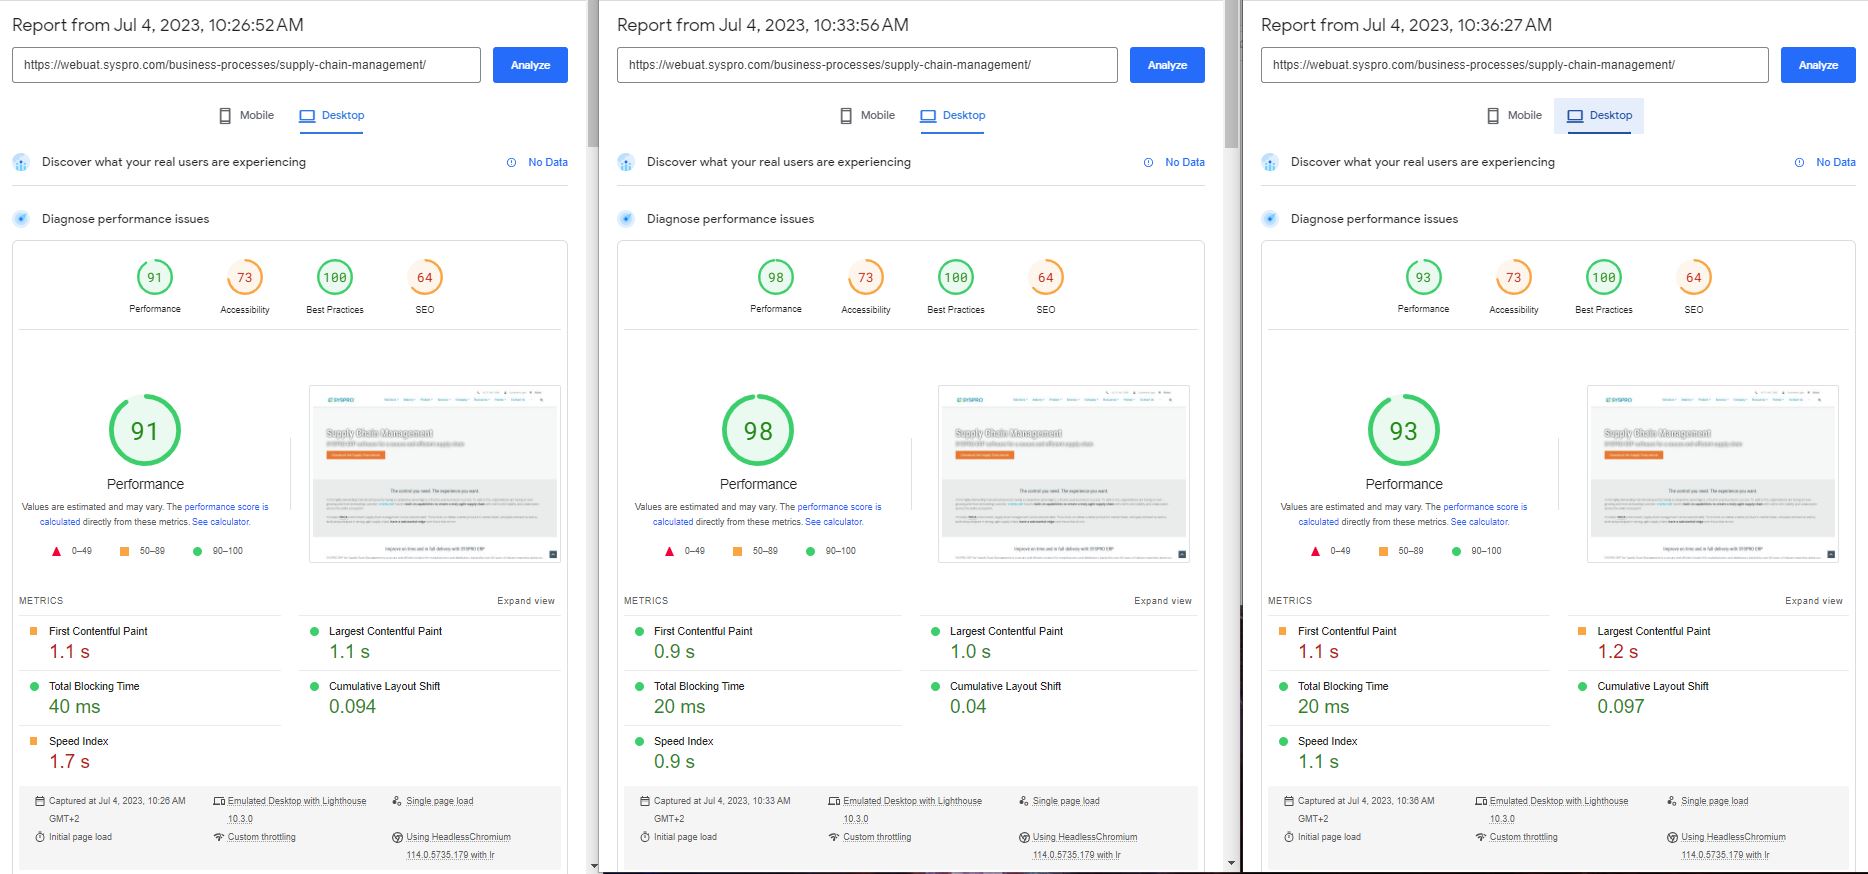
| Supply Chain Page Desktop Post-Opt | 91 | 98 | 93 | 94 (+8) |